The moving guide
What this site can actually help you with when you move, and what it cannot.
What are you actually paying for?
Price explains almost everything about an area, but it never tells you which part of it is worth anything to you. That is the question we are trying to answer.
Why we run everything on our own servers
The map, the tiles, the routing engine and the analytics all sit on our own machines in Sweden. It is more work, and that is exactly the point.

For businesses: find the location before your competitor does
The site analysis mode shows where the customer base is and where competition is missing, sector by sector. Here is how to use it today, and where our business products are heading.
The travel planner: real journey times, not straight lines
The map now plans journeys by public transport and car on real timetables, in our own routing engine. The same engine powers the analysis of your pins.
Everything you do not know when you move within Sweden
You can research the home in detail and the life around it barely at all. Here are the uncertainties that make moving hard, what we can answer today, and where pin mode is heading.
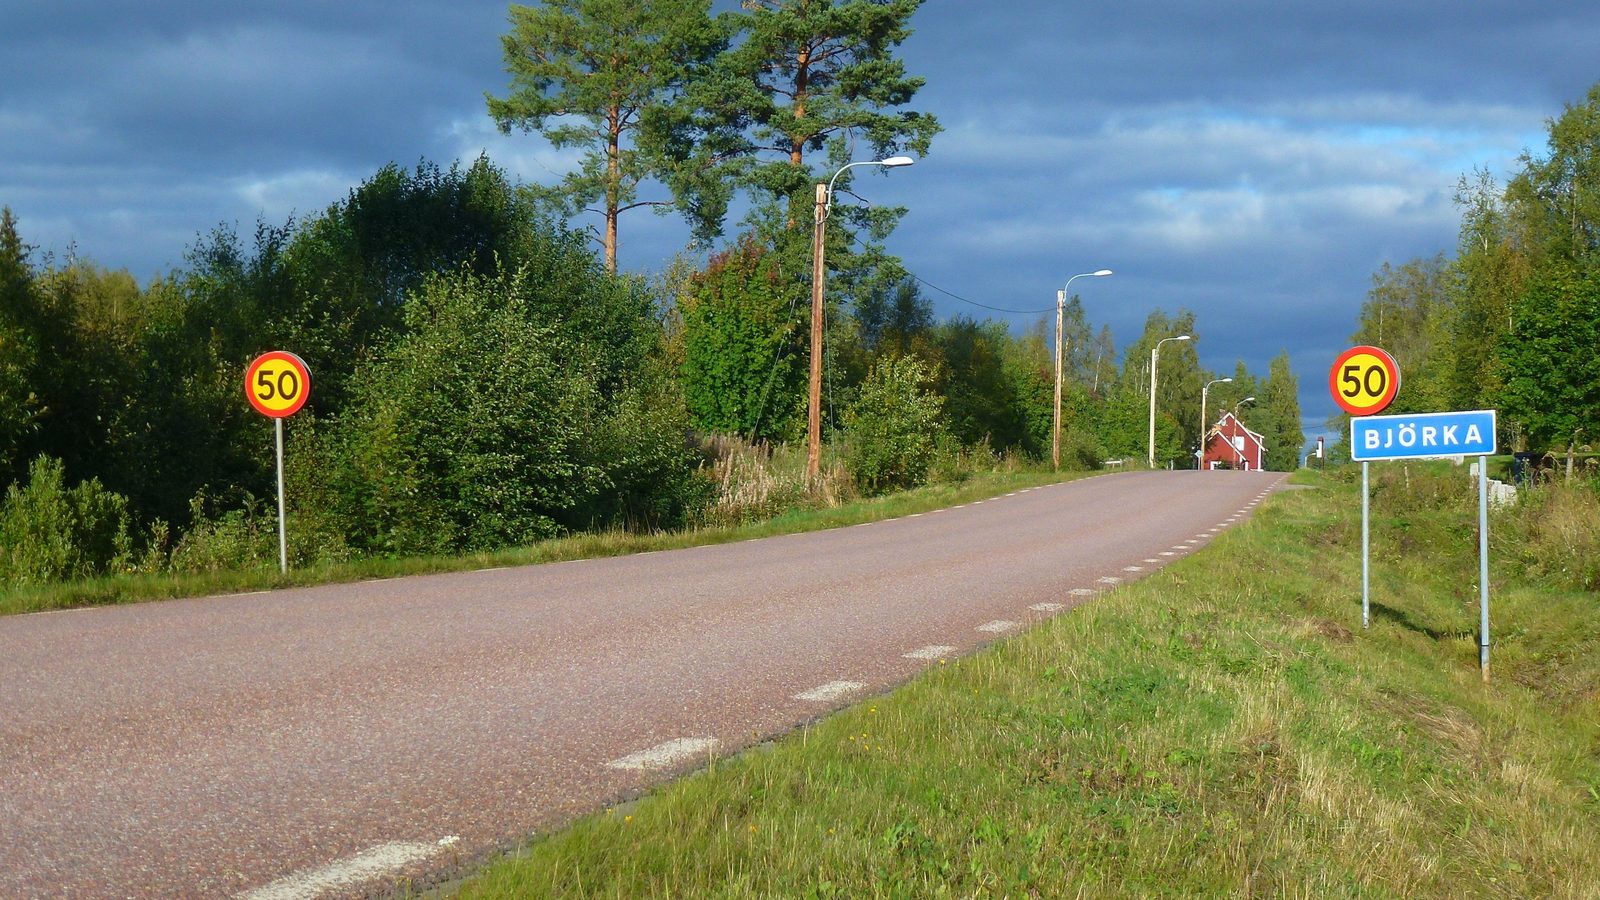
Who we are and what we are trying to build
Choosing where to live is one of the biggest decisions people make, and one of the worst supported. Here is what we are building, why, and how to reach us if you want to be part of it.
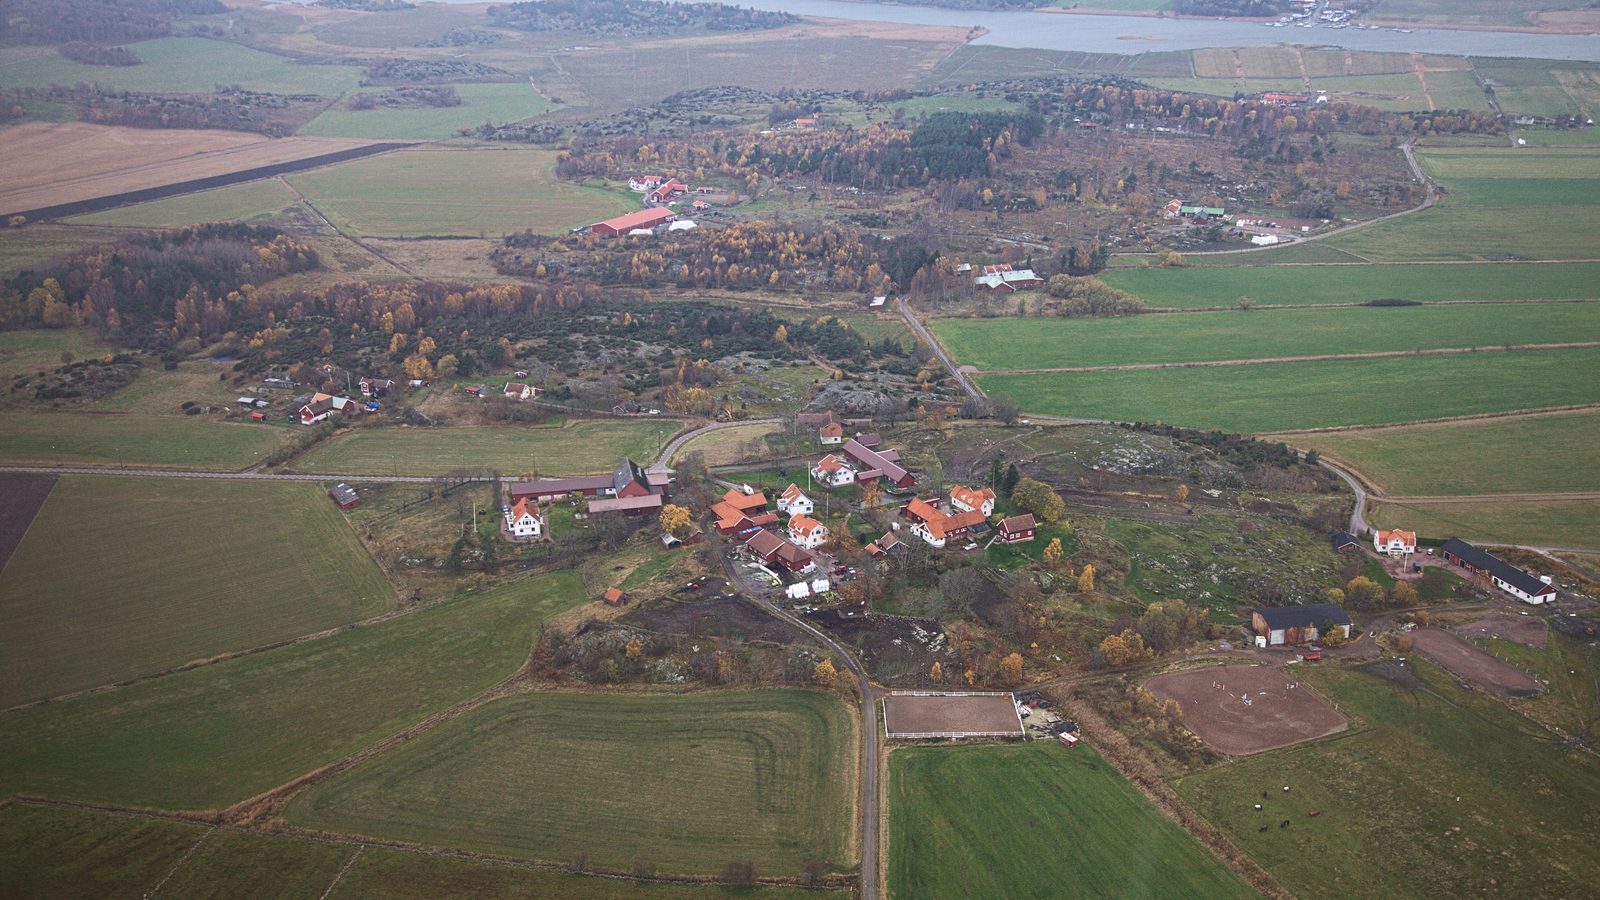
Winter can be measured, day by day
Sunshine, temperature, snow, rainfall and wind for all 290 municipalities, with a slider for day of the year. Drag it and see how different Sweden really is in January.
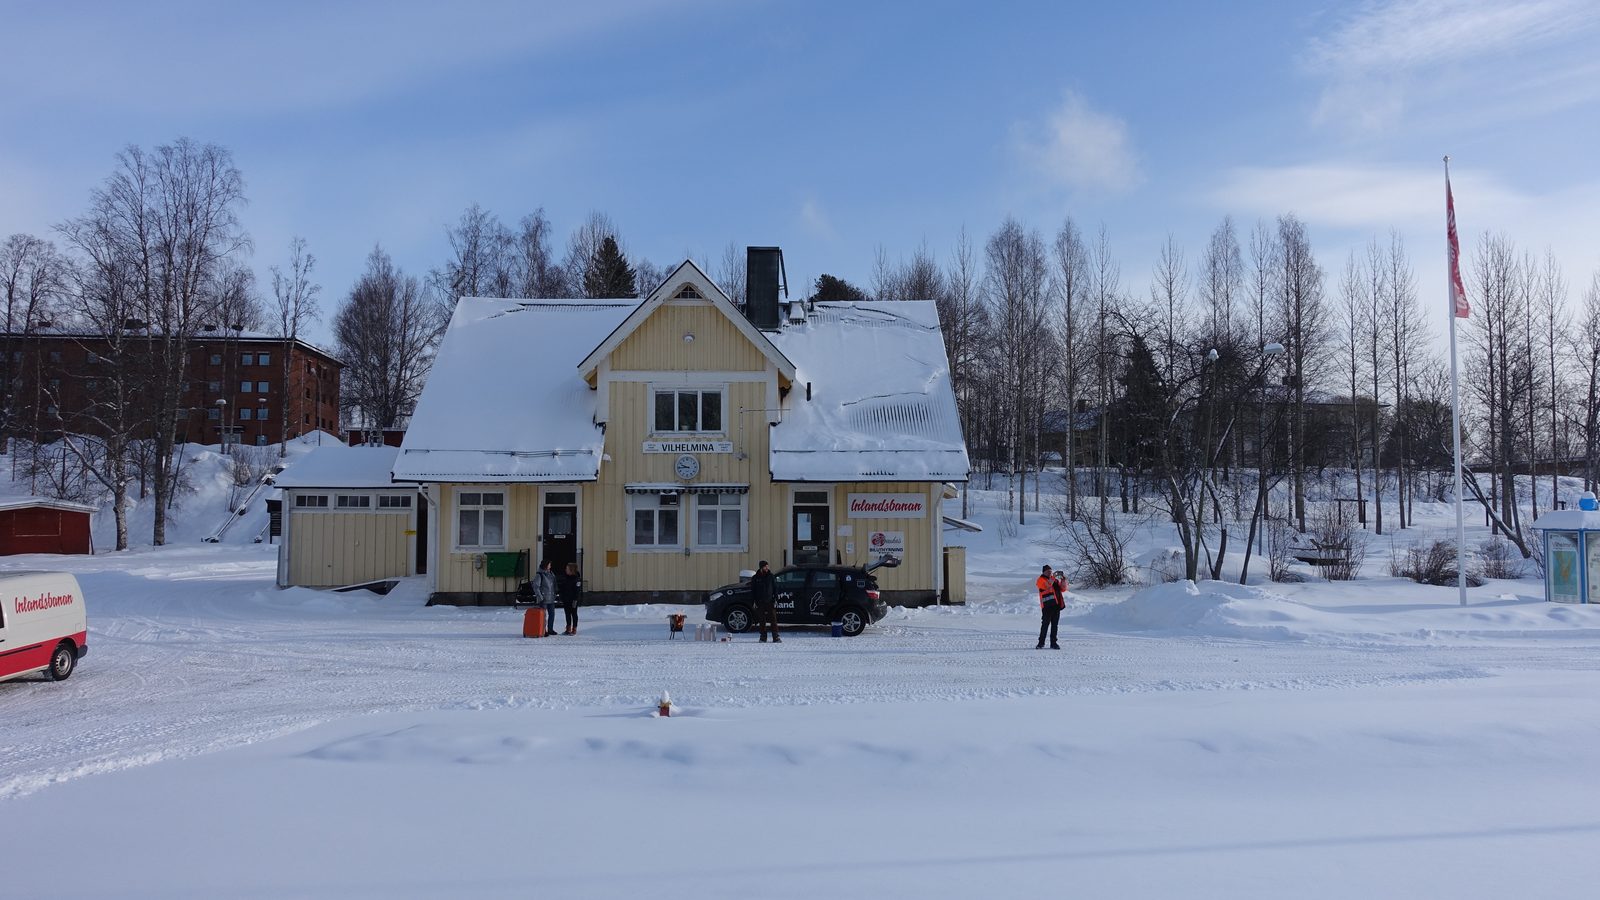
What is actually within walking distance?
The map carries around 120 categories of places in fourteen groups, from health centres and grocery shops to bars and sports halls. Switch on the ones you care about and the area answers for itself.
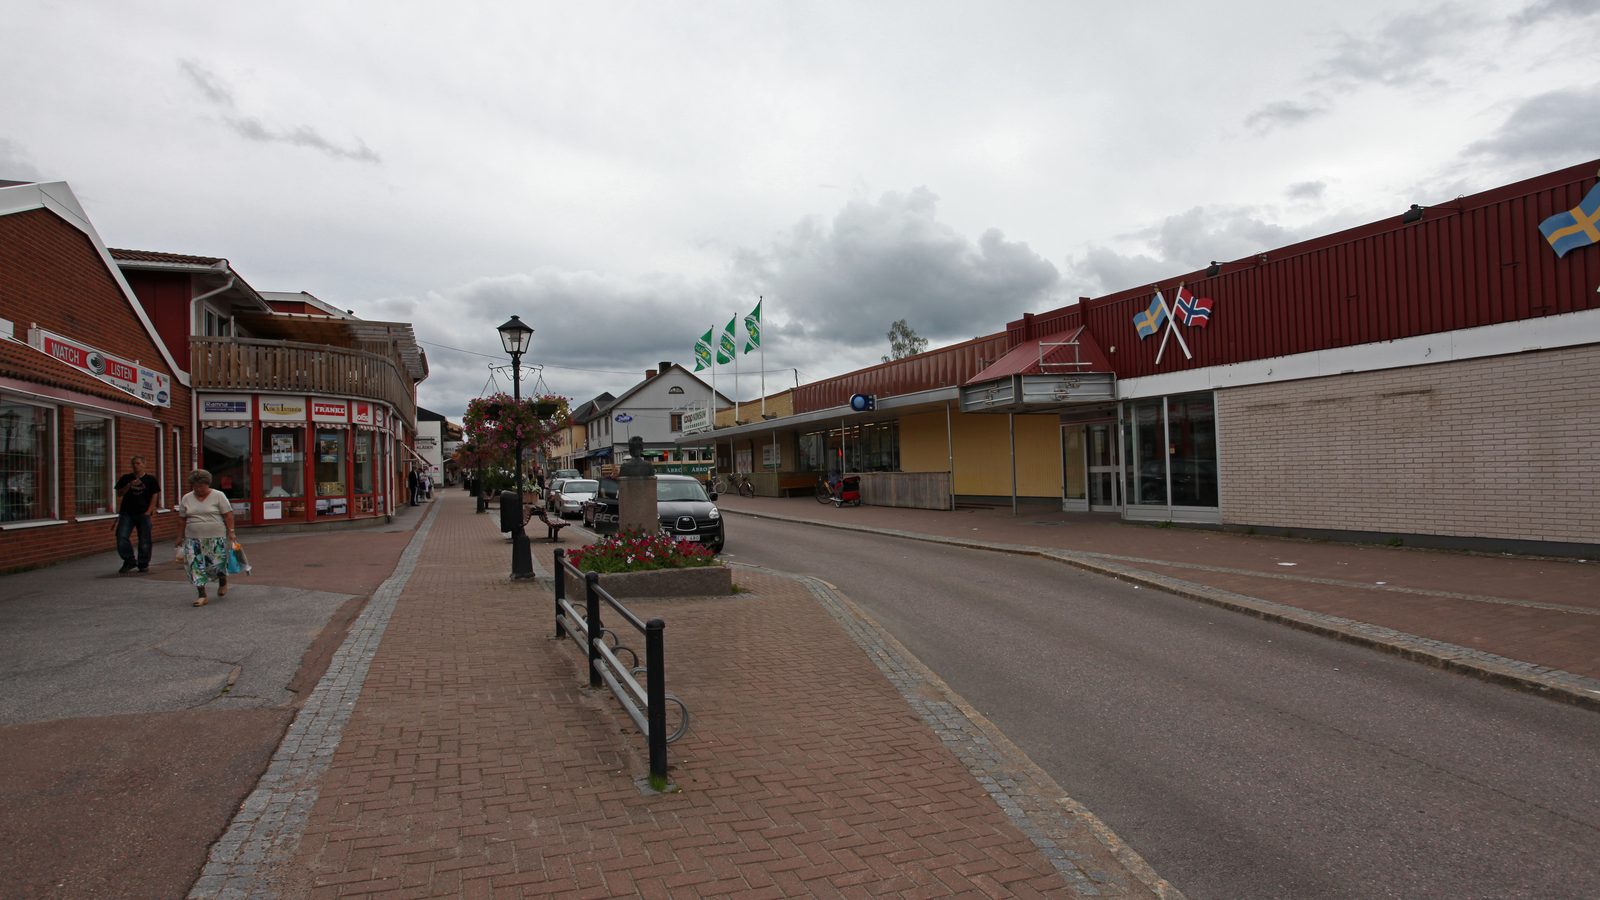
What is under the house? Soil type and radon on the map
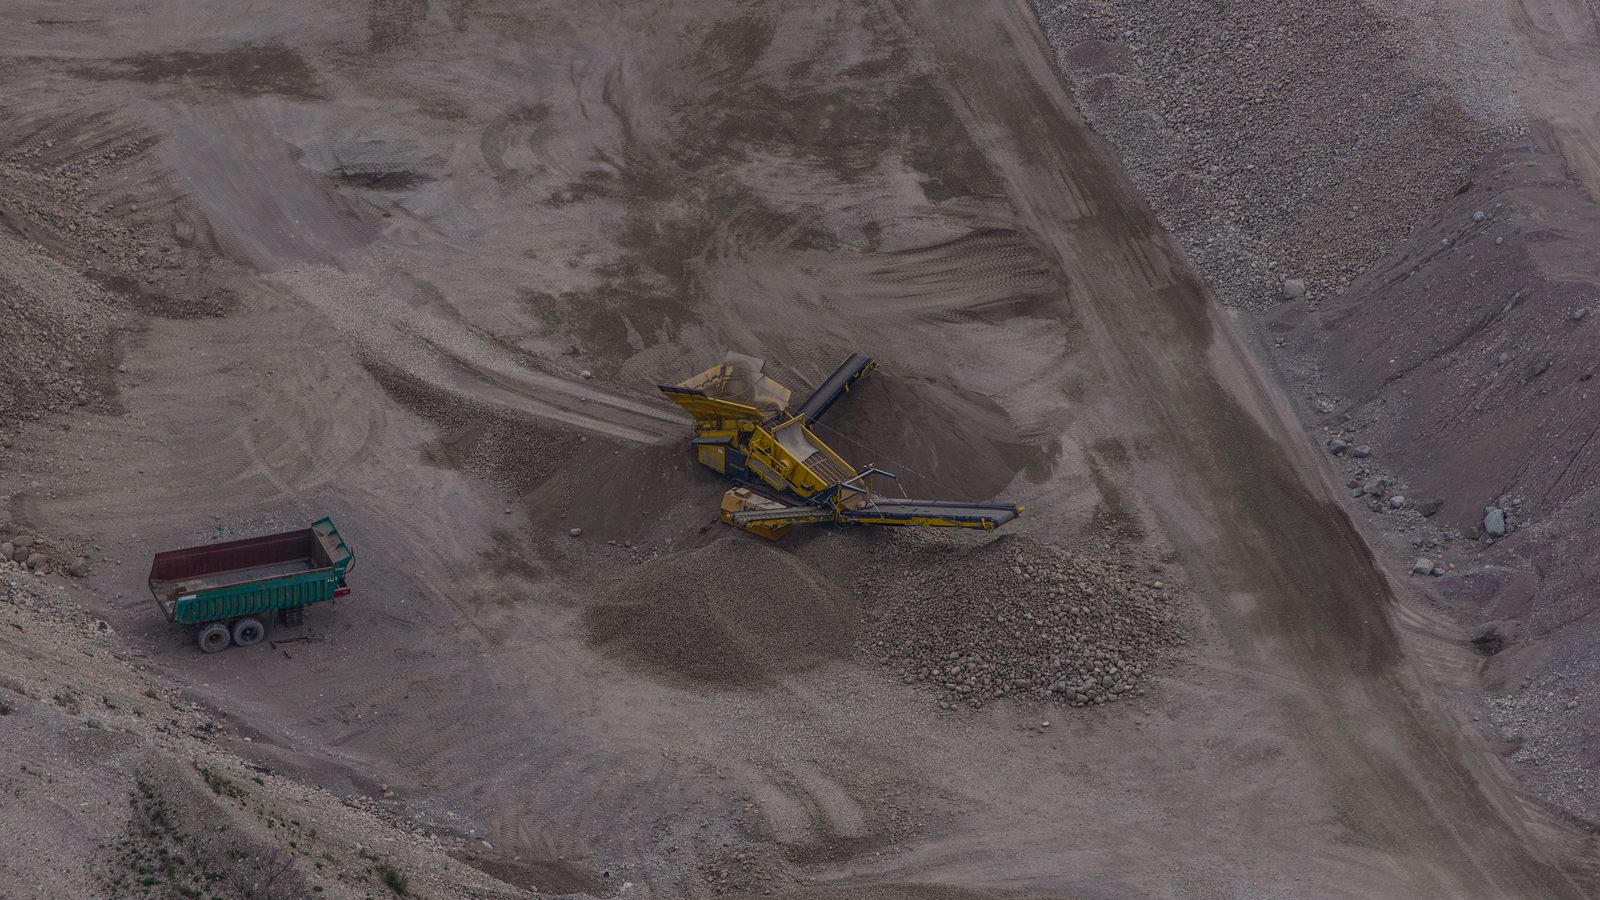
The ground decides drainage, foundations and radon risk, and never shows up at a viewing. The Geological Survey of Sweden's soil map is now on the map.
The average lies about the municipality
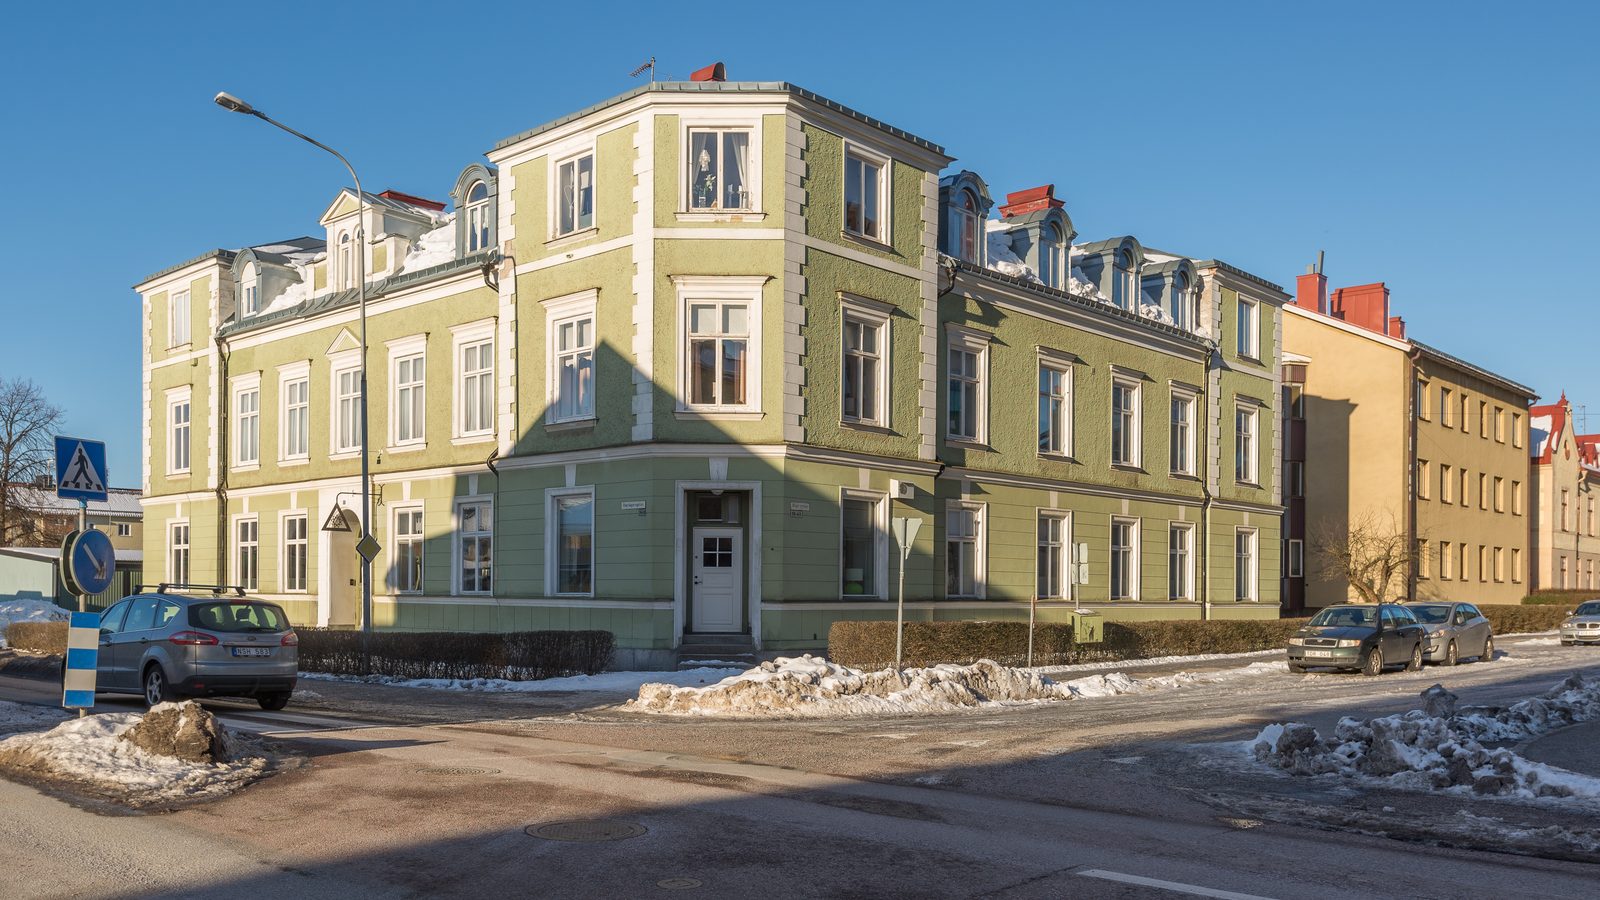
A municipality can contain two completely different realities and still report one tidy average. Here is how to get past it, down to towns and neighbourhoods.
Zoom in far enough and the map stops talking about municipalities
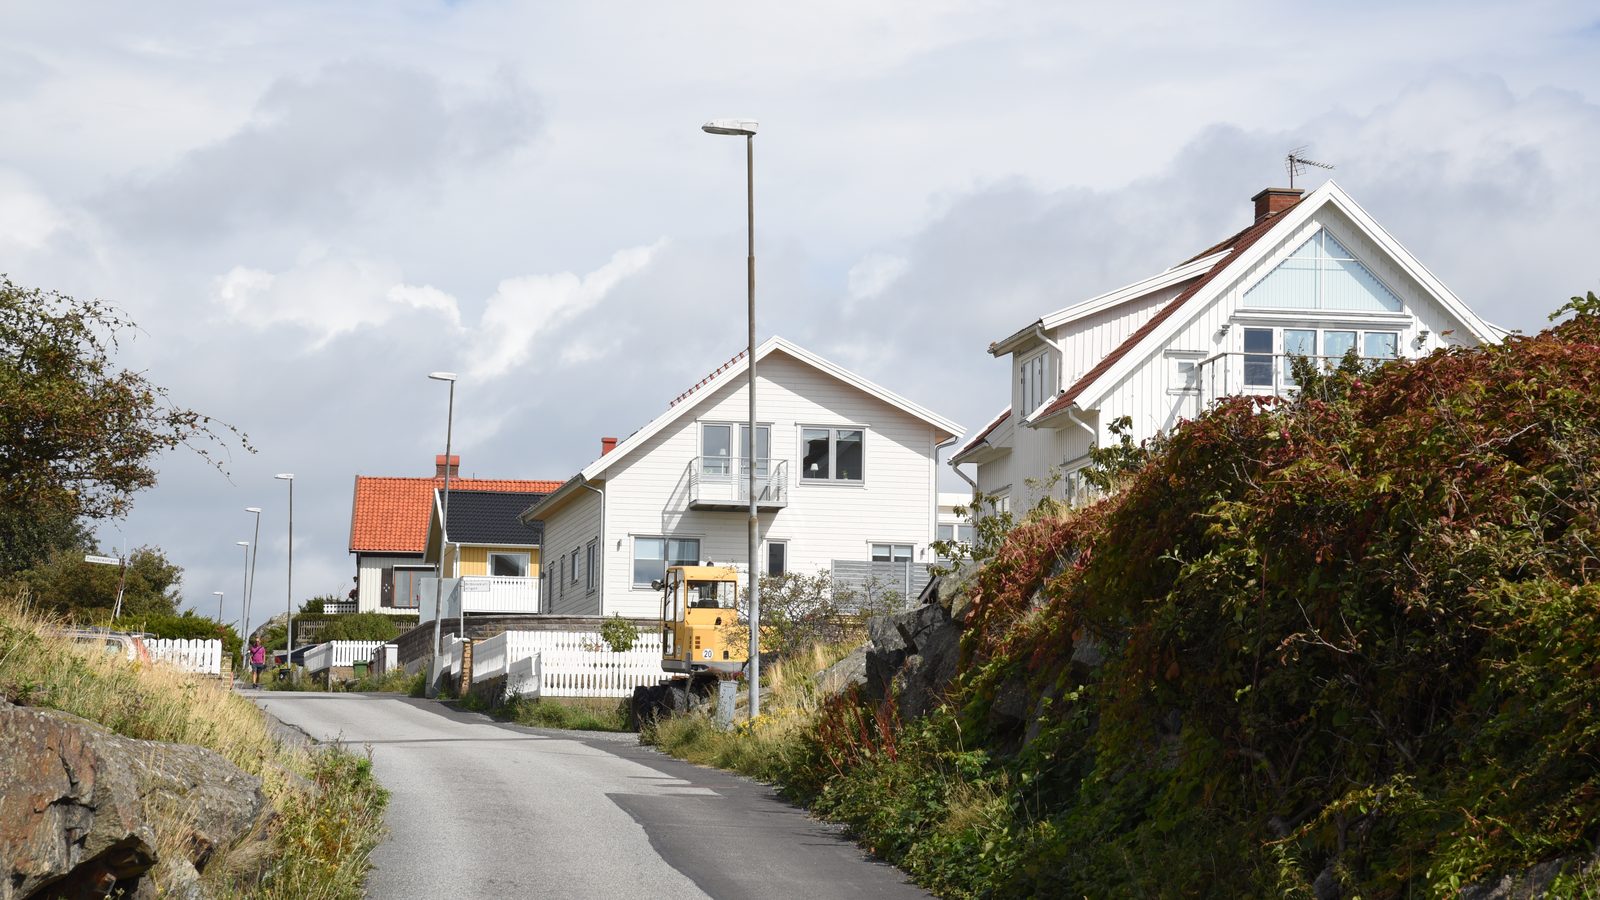
Property mode colours individual plots by construction year, plot size, assessed value, noise level and distance to everything from the grocery shop to the power line.
Electricity is a moving question, not just a bill
Sweden is four electricity zones and 290 grid fees. Where you live decides what you pay for the same kilowatt hour, and the difference is clearest on a map.