The average lies about the municipality
A municipality can contain two completely different realities and still report one tidy average. Here is how to get past it, down to towns and neighbourhoods.
If a municipality has an average income of 340,000 kronor, that can mean two things. Either almost everyone earns roughly 340,000, or half the municipality earns 220,000 and the other half 460,000. Those are two completely different places to move to, and they look identical in the table.
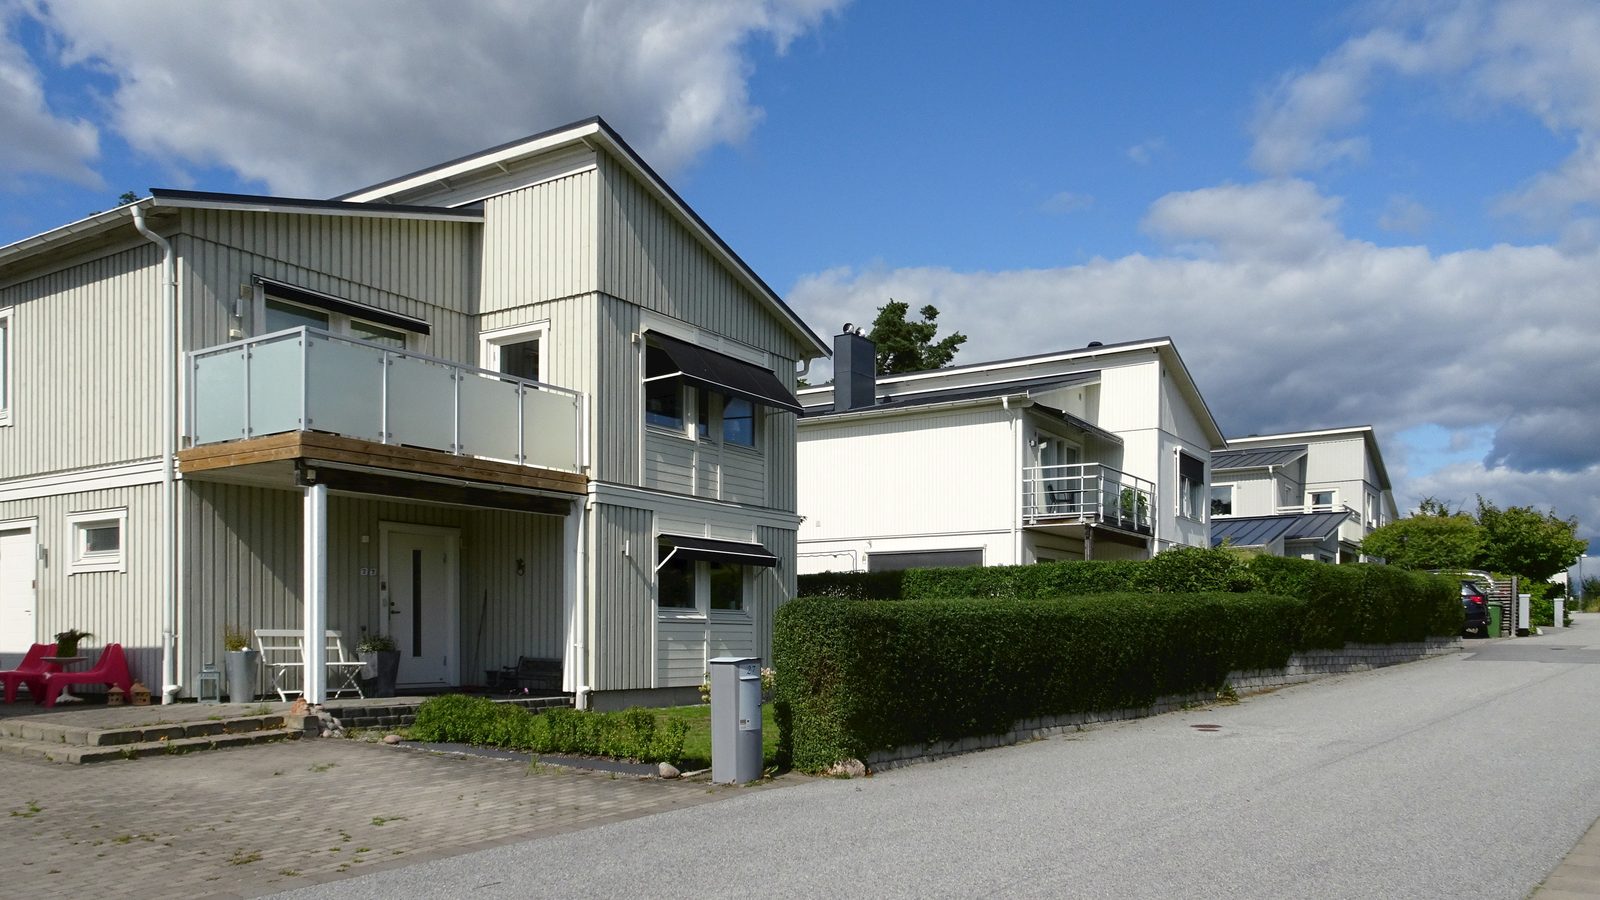
The same applies to nearly every figure reported per municipality. The house price in a municipality with both waterfront villas and post war housing estates is an average of something that does not exist.
The municipality is the wrong unit for most questions
Municipal borders are administrative. They were not drawn around how people live, commute or thrive. Yet they are the unit nearly all public statistics are reported in, simply because the municipality is what reports.
That makes them excellent for some questions. Municipal tax, childcare fees, water fees and waste fees are genuinely set by the municipality and apply across all of it. But population, income, housing type and building stock vary more within a municipality than between neighbouring ones.
Go down one level
On the map you can switch the region level from municipality to towns and neighbourhoods. Smaller areas inside the municipalities get coloured instead, and the picture often changes dramatically. The municipality that looked mediocre turns out to consist of a couple of genuinely attractive areas and a larger part dragging the average down, or the other way round.
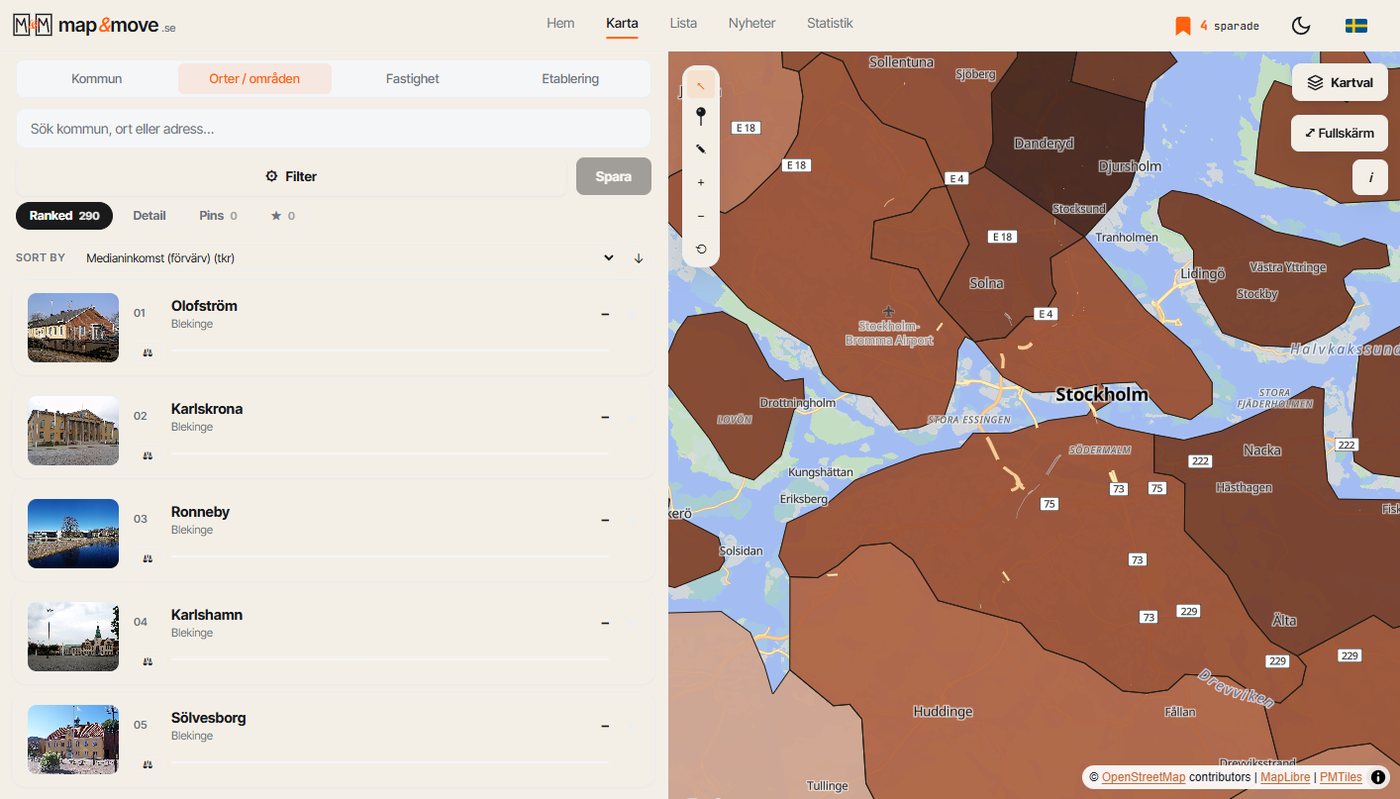
That is the level at which the question "is this a good place to live?" can actually be answered.
Three habits that make a comparison honest
- Compare at the right level. Use municipal figures for what the municipality decides, and area figures for everything about what living there is like.
- Look at the spread, not just the middle. Two municipalities with the same average price can have completely different ranges. The ranking on the statistics page shows where in the field a municipality sits, not only its value.
- Put them side by side. The comparison tool lines municipalities up against each other on the same indicators, which is harder to fool yourself with than reading two pages one after the other.
And remember what a number cannot do
No statistic answers whether you will be happy. It can, however, rule out the five areas where you definitely will not be, and that is usually where a move starts to become manageable.
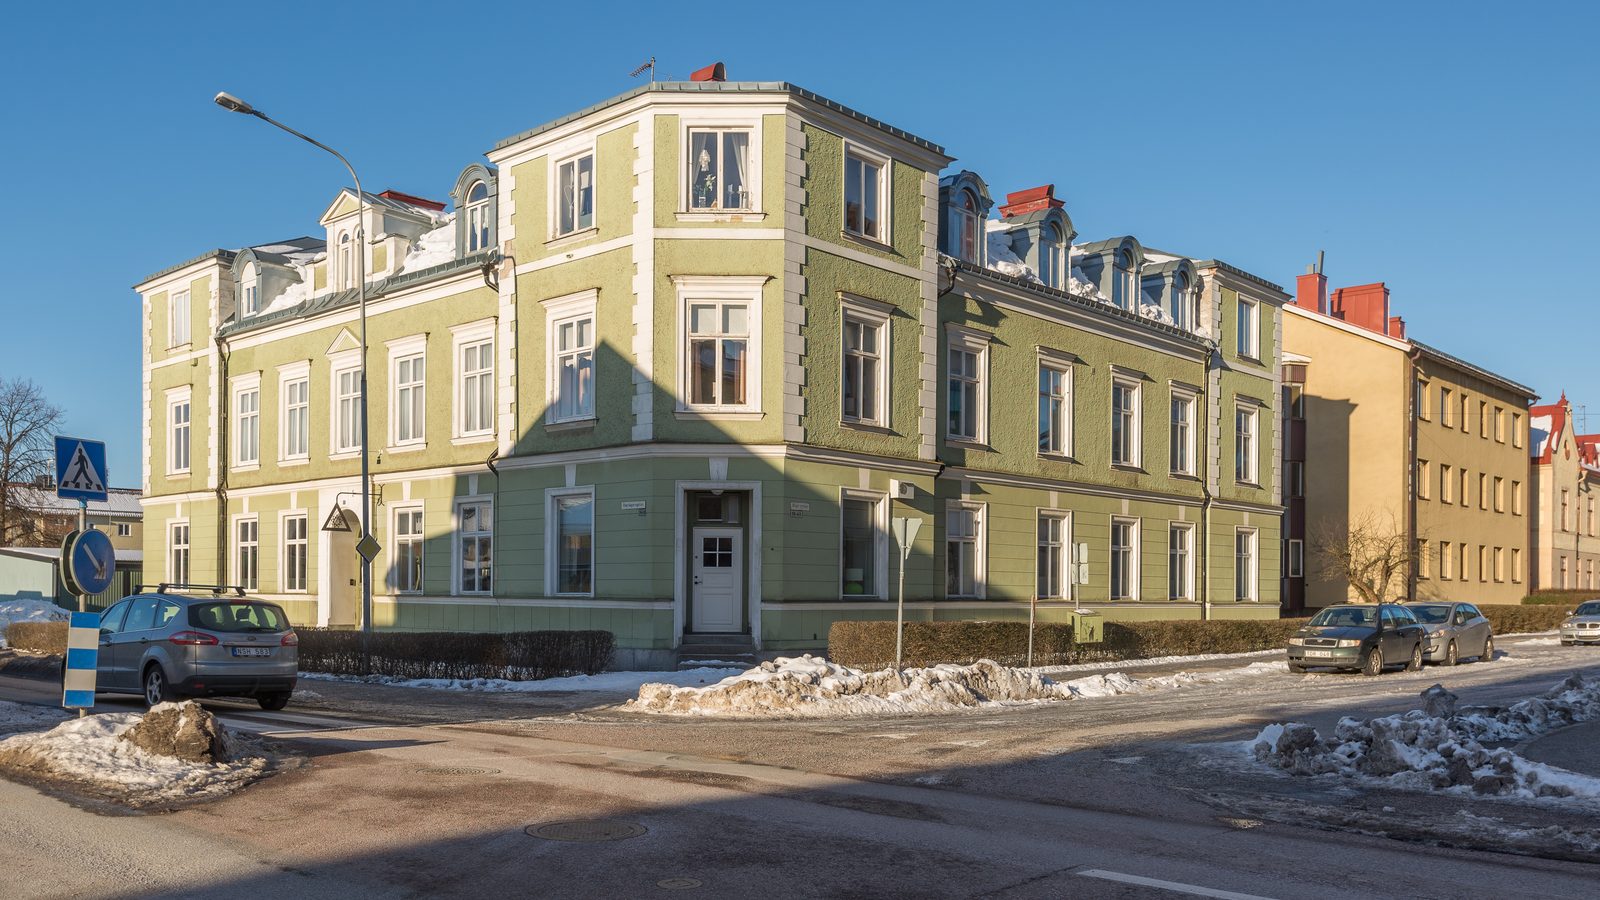
Photo: ArildV, street corner in Nyköping, Sweden, 2015. Licensed under CC BY-SA 4.0. The image has been cropped and downscaled.
One municipality at a time, straight to your inbox.
A letter every other week. No ads, no reselling.