Electricity is a moving question, not just a bill
Sweden is four electricity zones and 290 grid fees. Where you live decides what you pay for the same kilowatt hour, and the difference is clearest on a map.
Most people think of the electricity price as something that happens in November and cannot be influenced. In reality it is one of the few everyday costs that changes dramatically with where you choose to live, and it never appears in the property listing.
Four zones and an invisible border
Sweden is divided into four electricity zones, from SE1 in the far north to SE4 in the south. The same hour, the same kilowatt hour, can cost several times more in the southern zone than in the northern one. Production sits in the north, consumption in the south, and the transmission grid cannot move the power between them fast enough.
The border between the zones does not run where you would guess. It does not follow county lines and it is invisible on the ground. You can move forty kilometres into a different price zone without ever passing a sign that says so.
The map carries the zone borders as their own layer. Switch it on and you see exactly where the line runs and which municipalities sit uncomfortably close to it.
The grid fee is the other half
The spot price is only part of what you pay. On top of it sits the grid fee, set by the local network owner and varying considerably between municipalities even inside the same zone. Add energy tax, and two households with identical consumption can differ by thousands of kronor a year depending on where they live.
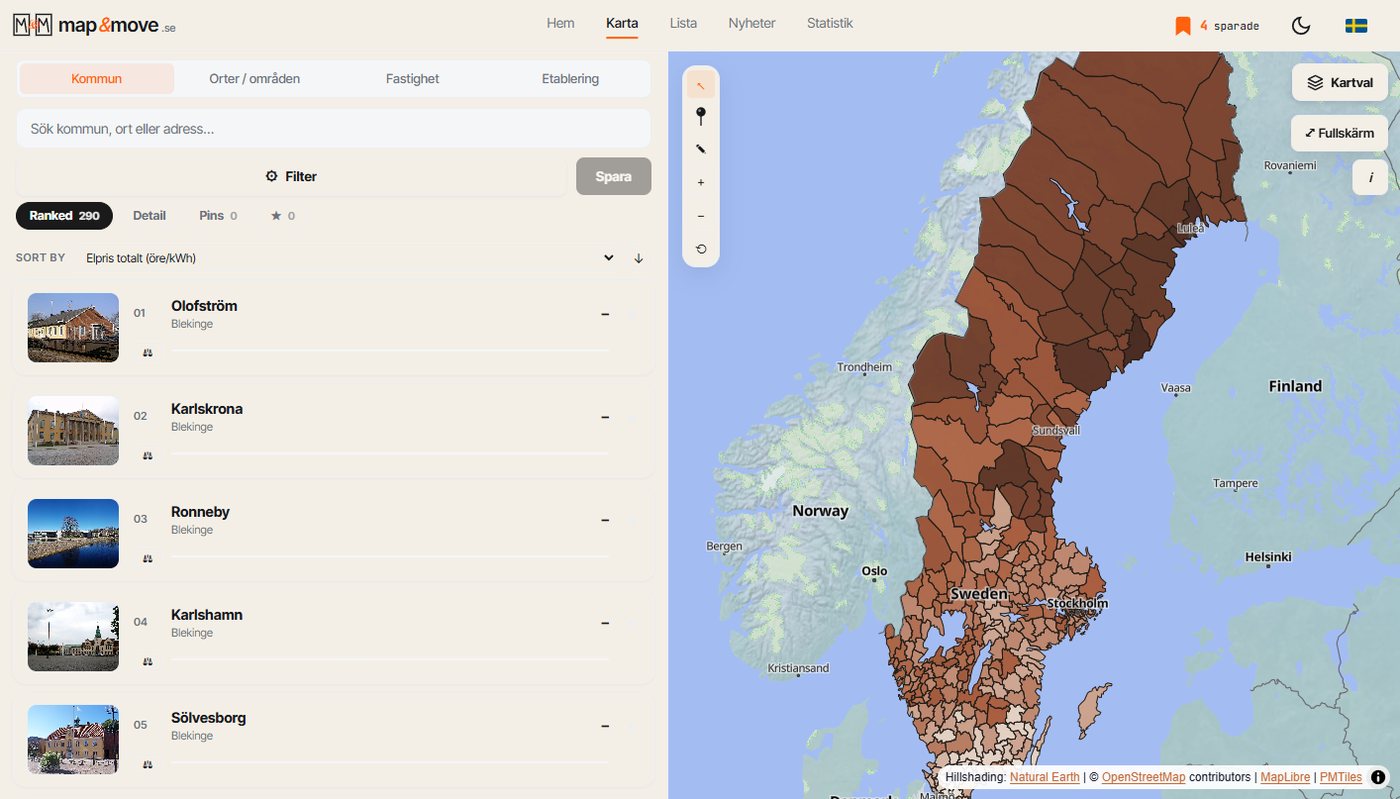
That is why the map carries four separate indicators rather than one:
- Spot price for the municipality's zone
- Grid fee for the municipality
- Energy tax
- Total electricity price, meaning the sum you actually pay
Colour all 290 municipalities by the last one and you get Sweden's electricity cost map as it looks to a real customer, rather than as it looks on an exchange.
What to do with it
If you have electric heating, a heat pump or plans for a car charger, the difference stops being academic. Work from your actual annual consumption rather than from a price per kilowatt hour. If two candidate municipalities sit in different zones, that can be the single largest recurring difference between them, larger than the difference in municipal tax.
And if the house you are looking at sits near a zone border, check which side it is actually on. The map answers that in three seconds.
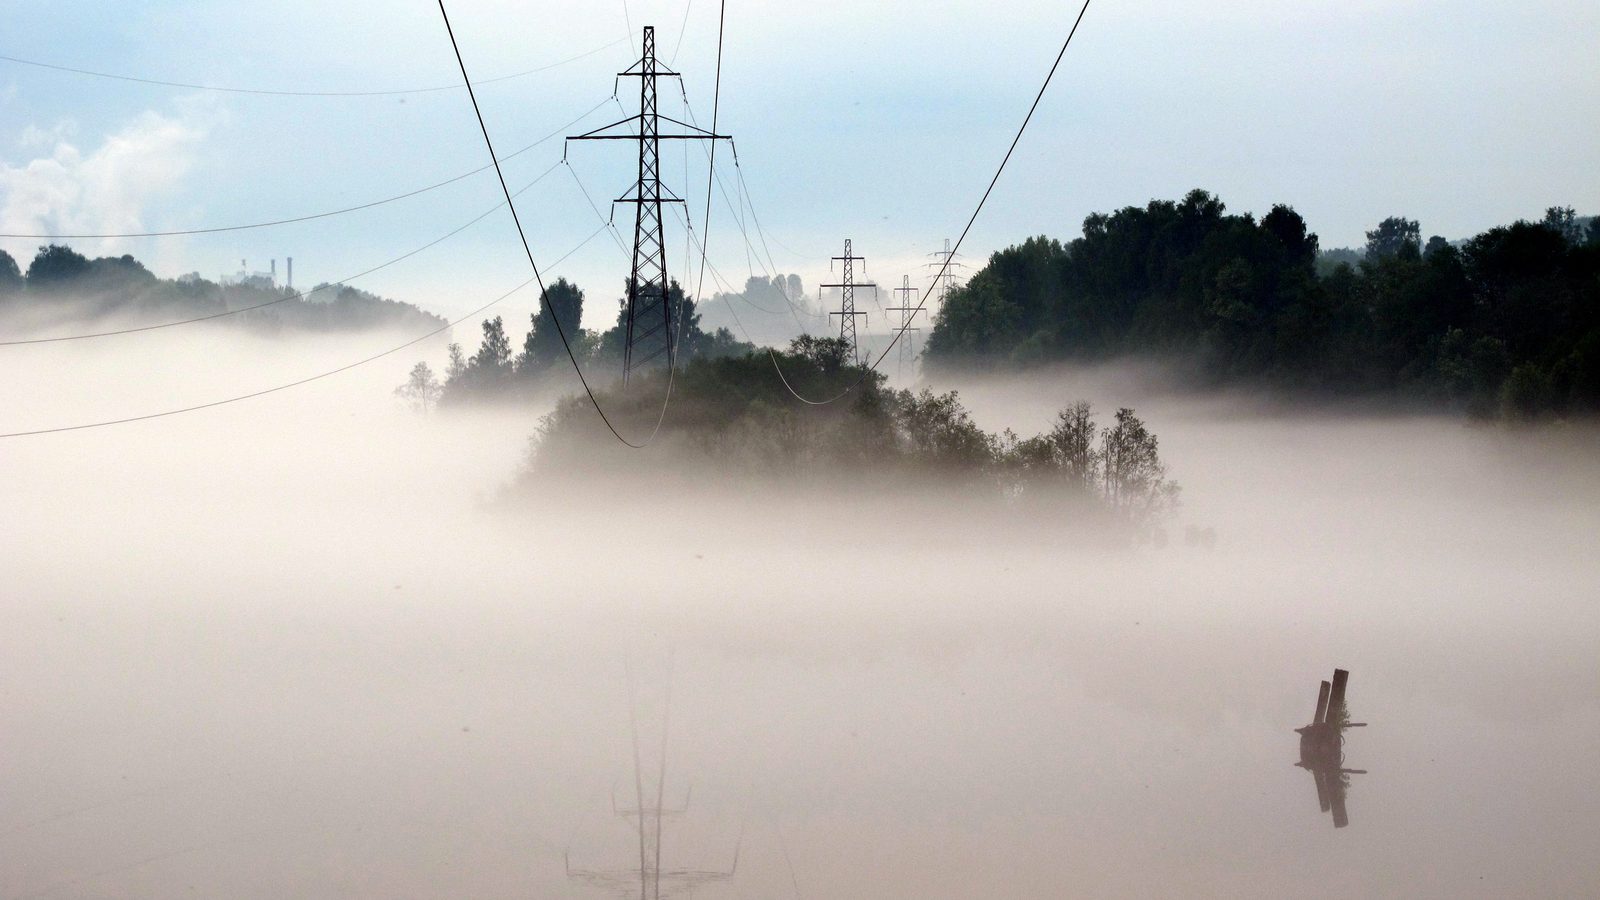
Photo: Edaen, power line in fog at Domnarvet, Sweden, 2016. Licensed under CC BY-SA 4.0. The image has been cropped and downscaled.
One municipality at a time, straight to your inbox.
A letter every other week. No ads, no reselling.