Commuting in and out · 2024
33.2 % / 27.1 %
Commuting inCommuting outKolada N02276 / N02279
Share of the employed who cross the municipal border to get to work.
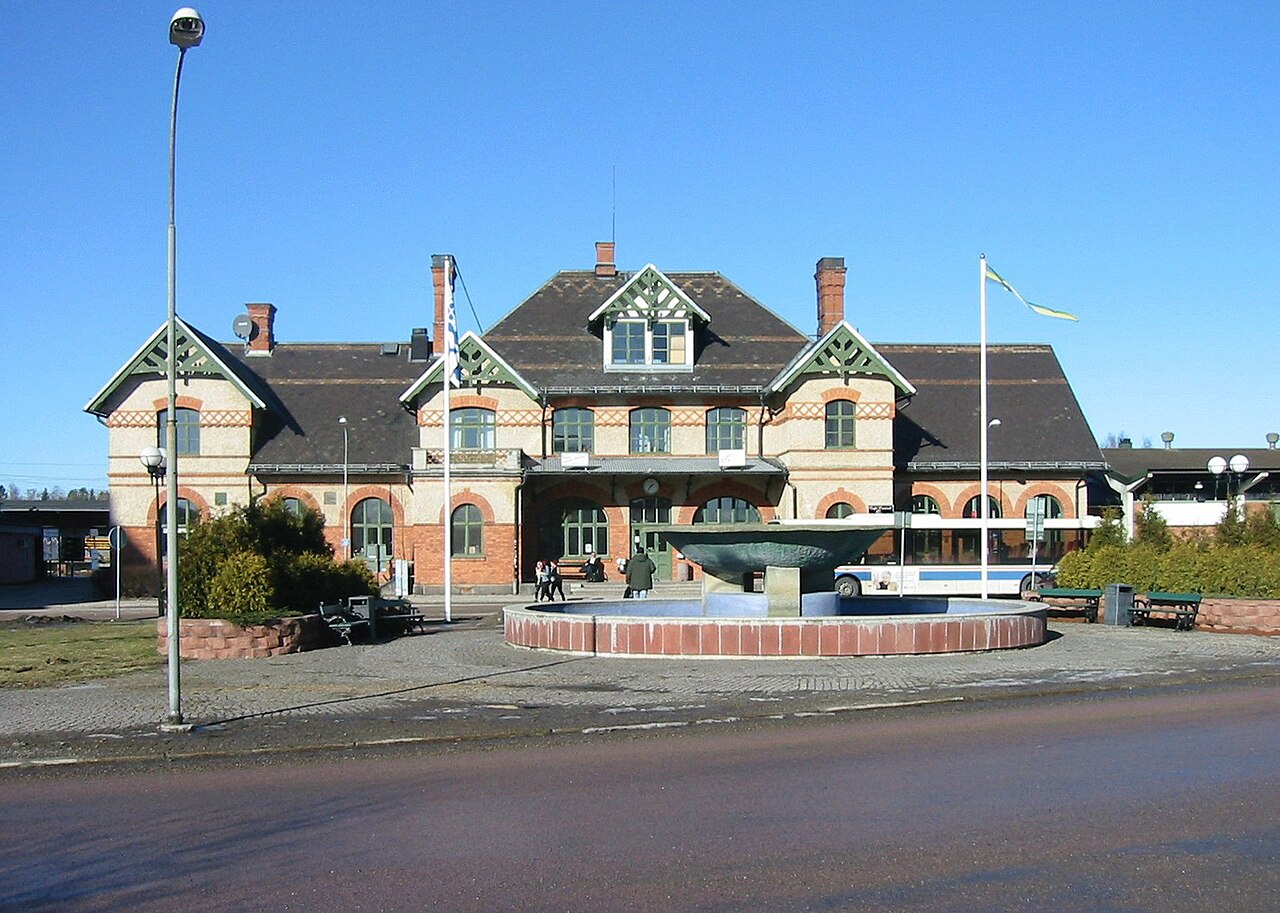
Short answer: Fagersta is in Västmanland County. The municipality has 12,915 residents (Statistics Sweden 2025), making it Sweden's 176th largest. The population has fallen by 2.7% over the past five years. The main town is Fagersta. The municipality has 1 other town.
| Measure | Fagersta | Sweden |
|---|---|---|
| Residents | 12,915 | 10,605,529 |
| Villapris, tkr | 1,492 | 3,913 |
| Median incomethousand SEK per year | 380 | 401 |
| Unemployment | 8.5 % | 5.4 % |
| Municipal tax | 32.99 % | 32.38 % |
| Qualified for upper secondary | 77.4 % | 83.6 % |
Short answer: A house costs 1,492,000 SEK on average. That is the price actually paid in registered sales in 2025, not asking prices.
1,492,000 SEKis what a house costs on average here (2025)Sweden 3,913,000 SEK
The house price in Fagersta is 1,492 thousand SEK. A flat costs 2,788 SEK per square metre. Over 4 years the price has changed by −4 %.
Price is rarely what decides whether a move is possible. Supply is: how many homes are on the market while you are looking. The calculation below the chart converts the average house price into a monthly cost on two median incomes, so the number can be compared with the rent you pay today.
| Measure | Fagersta | Sweden |
|---|---|---|
| Housetkr | 1,492 | 3,913 |
| ApartmentSEK per square metre | 2,788 | 39,813 |
Kolada N07915, 2025 · Kolada N07908, 2025
The house price is Kolada N07915: average price for registered house sales, that is prices paid and not asking prices. The flat price is N07908, SEK per square metre. New construction is N07916, completed homes per thousand residents. The price change is measured between the two years closest to five years apart in the series, with both years spelled out.
Short answer: 77.4 % of ninth graders qualified for upper secondary school in 2026. Sweden is at 83.6 %.
77.4 %of pupils qualified for upper secondary school (2026)Sweden 83.6 %
Eligibility for upper secondary school is 77.4 % (2026). 28.1 % of residents aged 25–64 have post-secondary education.
The eligibility figure above is the municipality's aggregate, not the individual school's. It says something about the system and little about one child: the spread between schools within a municipality is routinely larger than the difference between two municipal averages. That is why the schools are listed one by one at the end of this chapter, with the figures the National Agency for Education actually publishes per unit — and with empty cells where it does not.
| Measure | Fagersta | Sweden |
|---|---|---|
| Qualified for upper secondaryof year 9 pupils | 77.4 %below the national figure | 83.6 % |
| Post-secondary educatedof 25–64-year-olds | 28.1 % | 48.5 % |
Kolada N15428, 2026 · Kolada N01982, 2025
Upper-secondary eligibility is Kolada N15428: the share of year 9 pupils eligible for a vocational programme, all pupils of the home municipality regardless of provider. Post-secondary education is N01982. The institutions come from data/education_data.json. The school rows come from the National Agency for Education's open API (planned-educations) and carry the latest year with a value per school; preschools are OpenStreetMap points without quality data and are therefore not in the list.
Short answer: 64 % feel safe out in their own neighbourhood.
64 %feel safe in their neighbourhoodSweden 75 %
64 % say they feel safe in their neighbourhood (SALAR 2022). Reported violent crimes number 1,524 per 100,000 residents.
Safety and crime do not measure the same thing and do not always move together. The first is a survey question about how it feels, the second is reported offences, which also rise when more people choose to report. Read them side by side, not as checks on each other.
| Measure | Fagersta | Sweden |
|---|---|---|
| Feel safein their neighbourhood | 64 % | 75 % |
| Reported violent crimesper 100,000 residents | 1,524 | 1,067 |
| Would recommend the municipality/100 | 33 | 63 |
SALAR citizen survey 2022 · Brå 2025
The health centres and emergency departments are points from OpenStreetMap (ODbL), the same source as the map's "Health & care" layers. The count is the points located inside the municipality; the distances are as the crow flies from the main town and are searched across the whole country, so the nearest emergency department may well sit in another municipality. We deliberately show no "nearest hospital" row: OSM's hospital tag covers everything from university hospitals to osteopathy clinics, and such a row would have pointed at the wrong building. Waiting times per health centre do not exist as open, joinable data, and Kolada's measures of primary-care access are reported per REGION, not per municipality — which is why no such figure appears here. The safety figure is Kolada N00610 from Statistics Sweden's citizen survey on behalf of SALAR — a survey, so perceived safety. Violent crime is N07403, reported offences per 100,000 inhabitants according to Brå. The citizen index is N00670 or N00667, the municipality as a place to live. The bar chart shows five offence types per 100,000 inhabitants, reported by place of offence, and the national median beside it is computed across all 290 municipalities in the same year.
Short answer: Fagersta names 5 places for information on its website, but does not describe them as places with heat or support.
In a serious disruption the municipality can offer heat, water, information or phone charging at such places. They are not open in everyday life. Look up your nearest one now and write it down, because the website may be out of reach during a power cut.
The municipality’s page · All municipalities on the Crisis preparedness page
Our reading of the municipality's website, 2026-11-04. The page is dated 2026-06-15.
Short answer: Unemployment is 8.5 %. If two of you are moving, both need to find something — that is where a move most often falls apart.
8.5 %unemployment among 16–64-year-olds (2024)Sweden 5.4 %
Unemployment among 16–64-year-olds is 8.5 % (2024). Median income is 380 thousand SEK per year. 27.1 % of those in work commute out of the municipality. There are 83 workplaces per 1,000 residents, and 62 % of them have no employees.
An unemployment figure says how many are looking, not how broad the offering is. Out-commuting says more: if many commute out, the labour market is larger than the municipality, but you may also have to count on travel time every day. The vacancies card is fetched live from the Swedish Public Employment Service and shows the situation right now.
| Measure | Fagersta | Sweden |
|---|---|---|
| Unemploymentof the labour force aged 16–64 | 8.5 % | 5.4 % |
| Median incomethousand SEK per year | 380 | 401 |
| Municipal taxmunicipality + region | 32.99 % | 32.38 % |
| Commute outof those in work | 27.1 % | 37.8 % (median) |
| Workplacesper 1,000 residents | 83 | 139 (median) |
| No employeesof workplaces | 62 % | 74 % (median) |
Kolada N02280, 2024 · Kolada N00906, 2024 · Kolada N00900, 2026 · Kolada N02279, 2024 · own processing of Statistics Sweden data 2025 · Statistics Sweden business register 2025 · (median) is the median municipality, where no national figure exists
Unemployment is Kolada N02280: openly unemployed and jobseekers in programmes, aged 16–64, as a share of the register-based labour force. Median income is N00906, aggregate earned income. Out-commuting is N02279. Workplaces come from Statistics Sweden's business register (2025); the per 1,000 residents figure is our own processing using Statistics Sweden's population for the same year.
Short answer: 1,395 departures on an ordinary weekday. Weekends are thinner, and weekend service is what decides whether you can manage without a car.
1,395departures on an ordinary weekdayMedian municipality 3,163
83 stops and stations on 6 lines. No rail service within the municipality.
Frequency is what makes a difference day to day, not whether a line exists on the map. A line with three departures a day cannot be planned around. The journey planner computes door to door by train, bus and car, so you can test the trip you would actually make.
Stops, lines and departures are counted from Samtrafiken's GTFS feed for a normal week. A stop is counted once even if several lines call there. Travel times in the journey planner are computed by our own MOTIS instance on the same GTFS data plus OpenStreetMap's road network. The airport at the bottom is the one with the most domestic routes among those at most 50 km farther than the nearest, measured as the crow flies from the main town. It is not necessarily the fastest to reach, and the route list is scheduled domestic traffic, without charter or international routes.
Short answer: 33.2 % of those working in Fagersta commute in, and 27.1 % of working residents commute out (2024).
Commuting in and out · 2024
33.2 % / 27.1 %
Commuting inCommuting outKolada N02276 / N02279
Share of the employed who cross the municipal border to get to work.
Departures on a normal weekday, week 7 · 2026
1,399
−24.1 % since 2022
Week 7, the same week every yearKoDa · Trafiklab
Departures from stops in the municipality on a normal weekday, measured in the same week every year from Trafiklab's historical timetables. Departures are not the same as trips: a trip calling at fewer stops produces fewer departures. The series is based on Dalatrafik, Västmanland.
Close to public transport · 2024
67.4 %
−1.2 percentage points since 2014
Share of residentsKolada N07418
Share of residents with a stop within 500 metres, counting stops with at least one departure an hour on weekdays 06 to 20. It measures access, not how much traffic runs, so it has its own chart.
Commuting is Kolada N02276 and N02279, share of the employed. Departures are counted from KoDa's archive of GTFS timetables in the same ISO week each year, for operators present throughout; departures are stop calls, not trips. Access is Kolada N07418, in percentage points.
Short answer: If pump prices rise 20 %, a household in Fagersta pays roughly SEK 2,340 more a year for petrol and diesel, against SEK 2,620 in the median municipality (2025, model).
Extra cost if fuel gets 20 % dearer · 2025
2,340 SEK per household a year
Median municipality: 2,620 SEK per household a year
FagerstaNational medianModel on Trafikanalys and SCB data
A model, not statistics: cars per household × the county's mileage × 0.065 litres per km × SEK 17 per litre × 20 %. Linear, so 40 % gives twice as much.
The oil shock on the mapPetrol, diesel and hybrid cars · 2025
0.92 per household
Median municipality: 1.03 per household
FagerstaNational medianTrafikanalys
Passenger cars in traffic at year end that run on petrol or diesel, divided by the number of households. Leased and company cars count where the company is registered.
Mileage per car in the county · 2025
1,150 Swedish miles a year
Median municipality: 1,150 Swedish miles a year
FagerstaNational medianTrafikanalys
Only available per county and for all passenger cars, so municipalities in the same county share the figure. A Swedish mile is 10 km.
Heating oil in homes · 2024
10 kWh per household a year
Median municipality: 19 kWh per household a year
FagerstaNational medianSCB EN0203
Fossil liquid fuel in houses and blocks of flats. Statistics Sweden withholds some municipalities.
Extra cost is a model, not statistics: the municipality's petrol, diesel and hybrid cars in traffic (Trafikanalys) divided by the number of households (Statistics Sweden), times the county's average mileage per passenger car (Trafikanalys, not available per municipality), 0.065 litres per km, SEK 17 per litre and a price rise of 20 %. The model does not account for people driving less when prices rise, for company cars or for leased cars being registered where the company is. Heating oil is Statistics Sweden's final use of fossil liquid fuel in homes. The sub measures are shown separately; we do not combine them into an index. Our own processing, not official Trafikanalys statistics.
Short answer: 10 nature reserves within the municipal boundary, 8 km² of protected land in total.
10nature reserves in the municipalityMedian municipality 16
Protected land, lakes, trails and the national parks within reach of Fagersta.
Distances are as the crow flies from the main locality, which is the most honest we can be without knowing where in the municipality you would live. A national park 120 km away is a weekend trip, not a Sunday walk — the figures are there to tell the two apart.
| Measure | Fagersta | Sweden |
|---|---|---|
| Nature reserves | 10 | 16 (median) |
| Protected landkm² | 8 | 25 (median) |
(median) is the median municipality, where no national figure exists
Nature reserves and protected area come from the Swedish Environmental Protection Agency's open data, lakes and watercourses from Lantmäteriet's map data, trails from OpenStreetMap and bathing spots from the Swedish Agency for Marine and Water Management's bathing site register. Distances to national parks are as the crow flies from the municipality's largest locality.
Short answer: The county boards have mapped 23 flood areas in Fagersta between 1901 and 2011. The Swedish Forest Agency has mapped 1 forest fire in Fagersta since 2018.
Past floods
23 mapped areas
Most in 1977 (20)
County administrative boards 1901 to 2011, CC0
One point per mapped flood and place in the county boards' national register. A single large flood can give many areas, and older events are less well documented, so a municipality with no hits may still have flooded.
Show the floods on the mapForest fires since 2018
1 fire
1.7 ha burnt
Swedish Forest Agency, CC0
Burnt areas of at least 0.5 hectares, mapped by the Swedish Forest Agency from satellite images and rescue service alarms. Fires with an unknown year are included.
Show the fires on the mapSatellite fire detections since 2021
1 detection
of which 0 strong (over 10 MW), latest 2022-12-19
SMHI, CC BY 4.0
A detection is a heat anomaly seen by a satellite, usually a fire but not a confirmed one. Cloud hides most of it, so the figure is a lower bound.
Show the detections on the mapFire bans
Live on the map
County administrative board decisions
County administrative boards, CC BY 4.0
The county administrative board decides on fire bans in dry periods, and the situation changes several times a week. That is why it is shown live on the map instead of in a page that is rebuilt now and then.
Show the fire bans on the mapThe figures are our own counts from the sources' map data: points and burnt areas belong to the municipality they lie in, zones and coastlines are clipped to the municipal border. Landslide risk and coastal erosion are only mapped in some areas, so a municipality with no figure there is unmapped, not risk free. SGU's landslide mapping, flood mapping, ground movement and groundwater aquifers exist as map layers but are not counted per municipality here. The sources are coarse and show where the risk should be investigated, not that it exists.
Short answer: It snows on 24 days a year here. But it is the December darkness people underestimate, not the cold.
24days with snowfall a yearMedian municipality 17
24 days with snowfall a year. 5.4 hours of sunshine per day on average across the year.
Daylight is derived from the municipality's latitude using the standard sunrise/sunset formula, ignoring clouds and horizon. Snowfall days and sunshine hours come from SMHI: a snowfall day is a day with at least 1 mm of precipitation and a below-freezing daily mean at the nearest station, median over the 1991-2020 normal period, which is not the same as how many days snow lies on the ground. Sunshine hours are SMHI's STRÅNG radiation model 2020-2024. The wind curves come from SMHI station observations 1991-2020, one file per municipality; when it is missing the cards are hidden rather than showing zeroes.
Short answer: 12,915 residents, −2.7 % over five years. The pace decides whether schools, care and services expand or shrink.
12,915residents in 2025Sweden +2.2 % over five years
12,915 residents in 2025. The population has changed by −2.7 % over five years.
The direction matters more than the level. A growing municipality builds out schools, care and shops; a shrinking one closes them, and it shows first in the smaller town. The only projection on this entire page is Statistics Sweden's population forecast — we never draw a trend line through gaps in the data.
| Measure | Fagersta | Sweden |
|---|---|---|
| Residentson 31 December 2025 | 12,915 | 10,605,529 |
| Growth 5 yrschange in population | −2.7 %shrinking | +2.2 % |
| Average pensiontotal pension per year | 272,342 krwomen 233,858 kr, men 314,568 kr | 263,440 kr (median) |
| State pensionaverage per year | 195,515 kr | 193,873 kr (median) |
Source: Swedish Pensions Agency 2025 · (median) is the median municipality, where no national figure exists
Population is Kolada N01951, Statistics Sweden's register-based population on 31 December. The five-year change is measured between the two years in the series closest to five years apart, with both years spelled out. The projection is Statistics Sweden's regional population forecast and exists only for population.
Short answer: Fagersta had 16,963 residents in 1970 and 12,915 in 2025. Statistics Sweden projects 12,522 by 2035.
Population · 2025
12,915
−23.9 % since 1970
Observed 1970 to 2025Statistics Sweden projection to 2035: 12,522Kolada N01951
Compared with Sweden: Fagersta has changed −23.9 % since 1970, Sweden as a whole +31.2 %.
That would mean residents in 2035. Your own what if, not a forecast.
Milestones
Kolada N01951 · SCB
House price · 2025
1,492 kSEK
+448.5 % since 1981
Observed 1981 to 2025National medianKolada N07915
Median income · 2024
380,300 kr
+98.1 % since 1998
Observed 1998 to 2024National medianKolada N00906
Unemployment · 2025
8.1 %
+9.9 % since 2010
Observed 2010 to 2025Kolada N03920
Unemployment benefit · 2025
5.8 %
−68.4 % since 1999
Observed 1999 to 2025Kolada N02890
Observed population from Statistics Sweden via Kolada. The projection is Statistics Sweden's own official population projection; we do not calculate it ourselves. Average price for registered house purchases. Housing prices are deliberately NOT projected: they revert strongly to the mean over five years, so a linear trend often gets the sign wrong in exactly the interval you want to predict. Total earned income, MEDIAN for residents aged 20–64 (Kolada N00906). No projection; we show outcomes only. Unemployment over time is Kolada N03920: unemployed registered with the Public Employment Service as a share of the whole population aged 18 to 65, not of the labour force, and therefore lower than the figure under Jobs (N02280, only available from 2020). No projection, because the business cycle drives it and it is not linear. Unemployment benefit is Kolada N02890: share of residents aged 20 to 64 who received unemployment insurance at some point during the year, from IAF. It is the longest series, from 1999, but only counts those entitled to benefit. The national median is the median of all municipalities in the same year, from the same Kolada series. The what if slider only scales Statistics Sweden's own path.
Short answer: Governance in Fagersta in 2025: cross-bloc coalition. The balanced budget result was 1.5 % in 2025. In 2026 the municipality received 25,182 SEK per resident in equalisation.
Governance · 2025
Cross-bloc coalition
Executive board chair: S, with M, C, L
SKR via Kolada N05829
Every municipality's governance on the mapMunicipal election · 2026
S 37.6 %
Largest party on the municipal council
Valmyndigheten
Every municipal election since 1973 on the mapBalanced budget result · 2025
1.5 %
National median 1.5 %
FagerstaNational medianKolada N03139
The year's result excluding capital gains, as a share of tax, state grants and equalisation. The law requires it to be positive, and about 2 % is usually seen as sound management.
Equalisation · 2026
25,182 SEK per resident
receives · 326 million SEK
FagerstaSCB OE0115
What the municipality receives (plus) or pays (minus) in the municipal equalisation system. LSS equalisation is a separate system and not included. Income equalisation is the largest part, and the latest year is Statistics Sweden's estimate for the current year.
Equalisation part by part on the mapGovernance is SKR's classification via Kolada (N05829). SKR counts MP as a left party only from 2022, so a municipality can change category between 2018 and 2022 without its governance changing. The election result is the municipal council election from SCB ME0104, not the general election. Finances refer to the municipality as an organisation, from Statistics Sweden's accounts via Kolada; the national median is the median of all municipalities in the same year.
Short answer: Of every 100 kronor, 44 go to schools and 42 to care (2025). That is 10 % less per resident than in similar municipalities. Debt is 27,995 kr per resident.
Out of 100 tax kronor · 2025
44 kr to schools
and 42 kr to care
74,449 krper resident
SCB OE0107
Kronor of every 100 the services cost net, i.e. what is paid with tax, state grants and equalisation. Click the ring for the row.
Every municipality's costs on the mapVersus similar municipalities · 2025
74,449 kr
per resident, similar municipalities 82,469 kr
Similar municipalities are RKA’s seven most alike: Flen, Hultsfred, Östra Göinge, Nordanstig, Krokom, Lycksele, Haparanda.
Cost level versus structure · 2025
−3 %
less than its structure justifies
RKA via Kolada
How much more (+) or less (−) the municipality spends than ages, distances and socio-economics justify under cost equalisation. Plus is not wrong: it can be a choice to invest.
What a place costs per year · 2025
130,611 kr
per compulsory school pupil
Kolada (RKA)
Net cost per resident · 2025
74,449 kr
+37.9 % since 2015
FagerstaSwedenSCB OE0107
Current prices: part of the increase is wages and prices, not more services.
Investment per resident · 2025
9,927 kr
Sweden 9,335 kr
SCB OE0107
Yearly average 2023 to 2025 by area below. Investment through municipal companies is excluded.
Largest investments · 2025
Nytt äldreboende
86 mnkr outcome 2025, investment via NVK
Årsredovisning 2025, Fagersta kommun
From the municipality's own report (in Swedish); each row links to its page. Amounts are the whole project where reported, otherwise the year's spend.
The full annual report (PDF, Swedish)Where the money comes from · 2025
58 kr of 100 is tax
92,188 kr in per resident
SCB OE0107
State grants in the central government budgetLong term debt per resident · 2025
27,995 kr
Sweden 62,738 kr
FagerstaSwedenSCB OE0107
The municipality as an organisation. A jump is usually an internal bank: the municipality borrows and lends on to its companies.
Net cost is what services cost after fees, rents and earmarked state grants, i.e. what is paid with tax, general state grants and equalisation. It comes from Statistics Sweden's municipal accounts (OE0107), in current prices, divided by the population on 31 December. Business operations such as water and municipal companies are excluded, so a municipality that runs schools or premises through a company looks cheaper in investments. Similar municipalities are RKA's seven most structurally similar ones (Kolada). Cost level is RKA's net cost deviation: how much more or less the municipality spends than its structure justifies according to cost equalisation. Long term debt also includes loans passed on to municipal companies.
Urban areas, small localities and villages with their own page, by population.
The median income is SEK 380,300 per year (2024). The average age is 44.5 years. The municipal tax rate is 32.99%. Unemployment was 8.5% in 2024.
Fagersta has 12,915 residents and is in Västmanland County. The average age is 44.5 years. The median income is SEK 380,300 per year. 64% of residents say they feel safe in the municipality. The mean annual temperature is 6.1 °C.
12,915 people lived in Fagersta Municipality in 2025 according to Statistics Sweden, making it Sweden's 176th largest municipality. The population has fallen by 2.7% in five years.
A condominium costs on average SEK 2,788 per m² (2025). A detached house costs on average SEK 1.5 million. The municipal tax rate is 32.99%.
Unemployment in Fagersta was 8.5% in 2024. The median income is SEK 380,300 per year. 28.1% of residents have post-secondary education.
28.1% of residents have post-secondary education. Condominium prices are SEK 2,788 per m².
77.4% of pupils in Fagersta qualify for upper secondary school (2026). The municipality spends SEK 132,595 per child per year on preschool. 64% feel safe in the municipality.
The mean annual temperature in Fagersta is 6.1 °C. In a typical year the warmest day reaches 30 °C and the coldest night -20 °C. 716 mm of precipitation falls each year, spread over 112 rainy days and 24 of them below freezing. The sun shines an average of 5.4 hours a day.
64% of residents in Fagersta say they feel safe (2022). Reported violent crimes stand at 1,524 per 100,000 residents.
The largest towns in Fagersta Municipality are Fagersta, Västervåla.